Spend Under Management
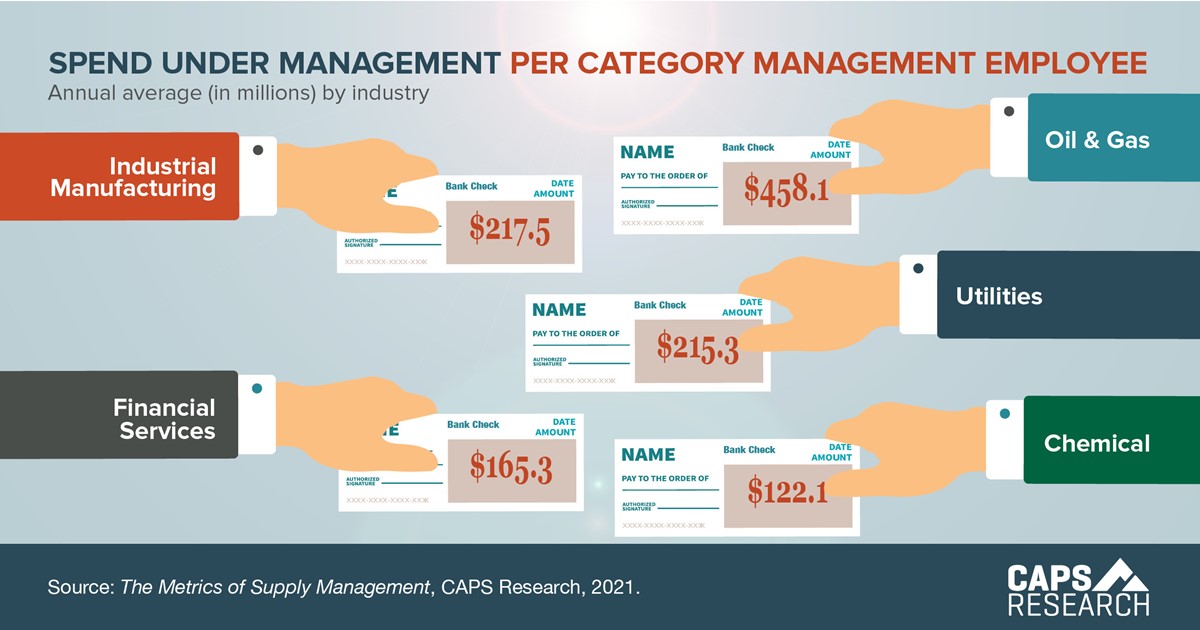
Across industries, category management employees comprise an average 17.9% of the total supply management headcount. How does your company compare?
Explore the 7 stages of our category management playbook in the CAPS blog. Members can access The Metrics of Supply Management: A Cross-Industry Report 2021 in the CAPS Library now. Anyone can reference the 2015 Metrics of Supply Management and industry breakouts with a free CAPS account.
Explore the 7 stages of our category management playbook in the CAPS blog. Members can access The Metrics of Supply Management: A Cross-Industry Report 2021 in the CAPS Library now. Anyone can reference the 2015 Metrics of Supply Management and industry breakouts with a free CAPS account.
About the author

CAPS Research
Non-members can receive the report of each survey they submit.
Members can access all reports, but are encouraged to submit surveys to
increase the comparative breakouts only they receive.