How effective and efficient is your supply management function? Sign up to participate in the CAPS Metrics of Supply Management - our annual cross-industry, metrics-rich survey - which produces a veritable treasure of KPIs on spend and value, org structure and employees, payment terms and transactions, and more.
The results of this survey are recognized for their leading, unbiased performance KPIs, specific to the supply management function. (Click below to see the metric breakdown.)
Sourceable spend as a percent of revenue (%)
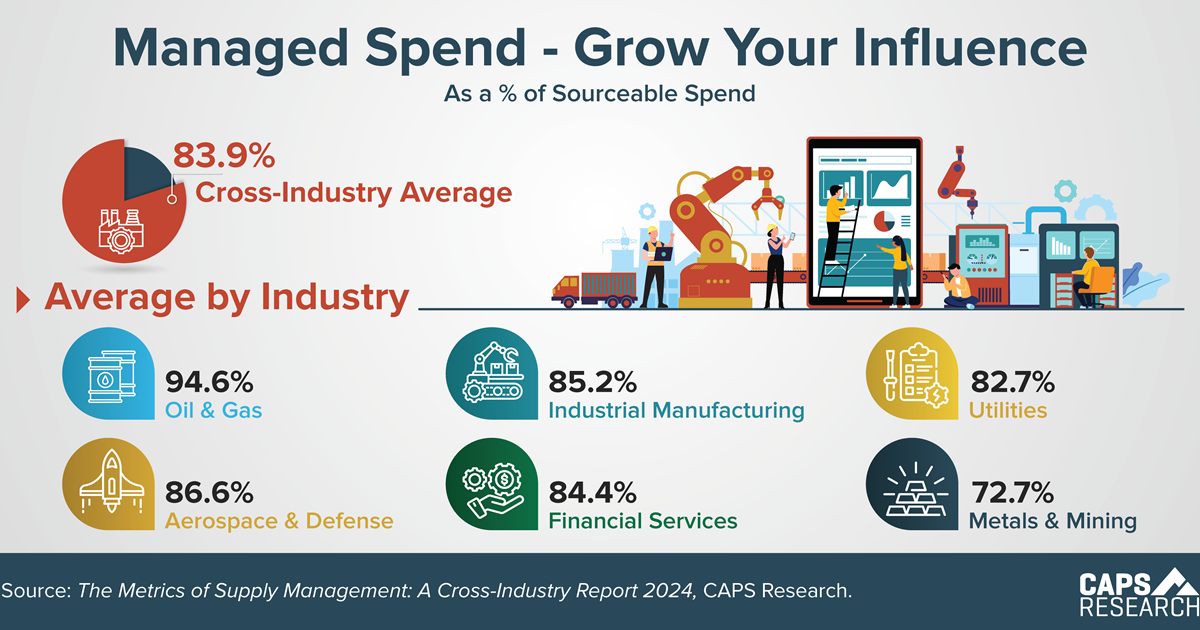
Managed spend as a percent of sourceable spend (%)
Direct managed spend as a percent of managed spend (%)
Indirect managed spend as a percent of managed spend (%)
Supply management organization structure that is centralized (% of companies) (%)
Supply management organization structure that is decentralized (% of companies) (%)
Supply management organization structure that is center-led (% of companies) (%)
Supply management operating expense as a percent of revenue
Supply management operating expense as a percent of sourceable spend (%)
Supply management operating expense as a percent of managed spend (%)
Supply management operating expense as a percent of direct managed spend (%)
Supply management operating expense as a percent of indirect managed spend (%)
Supply management salary expense as a percent of supply management operating expense (%)
Supply management talent development expense as a percent of supply management operating expense (%)
Supply management systems and tech expense as a percent of supply management operating expense (%)
Supply management systems expense that is self-funded (% of respondents) (%)
Supply management systems expense that is allocated (% of respondents) (%)
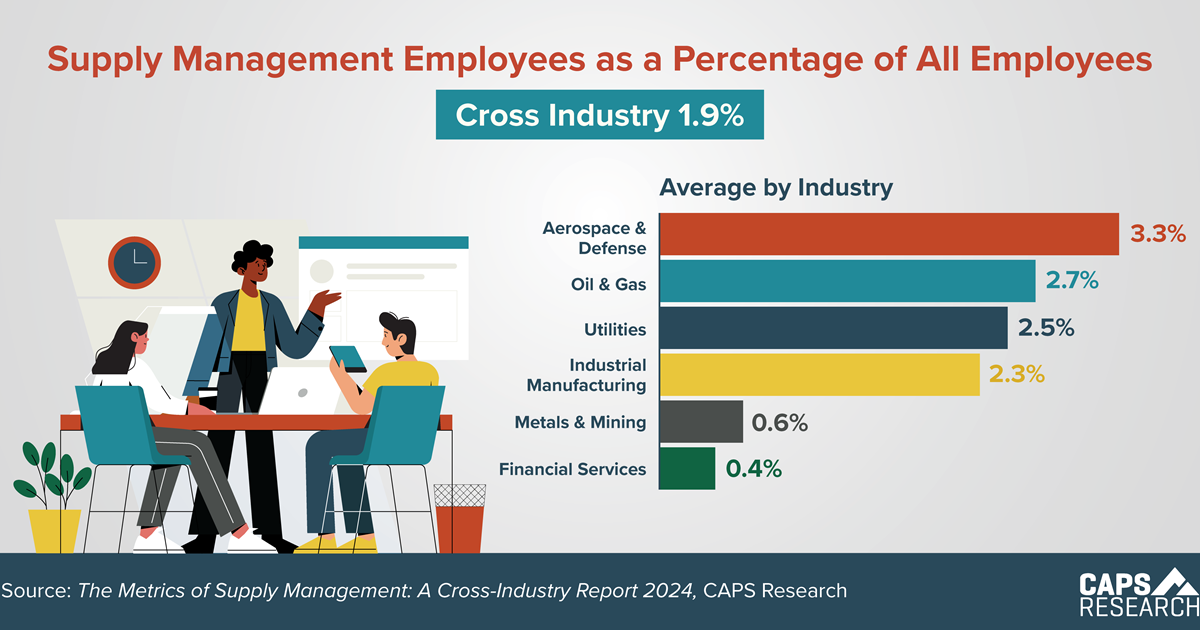
Supply management FTE as a percent of company FTE (%)
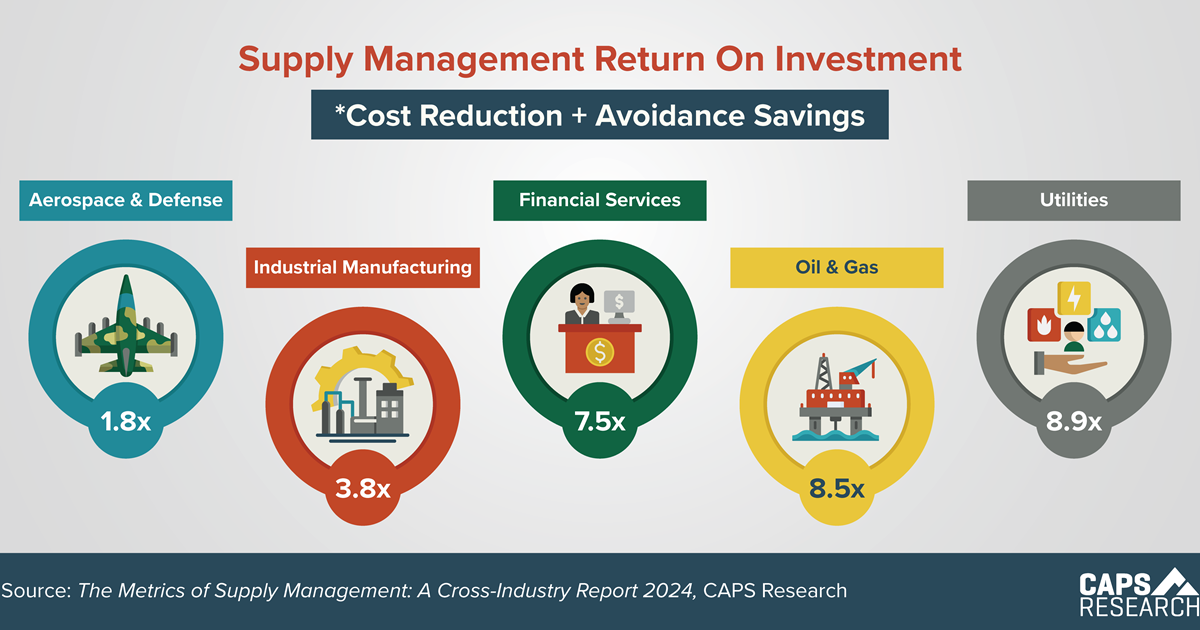
Supply management return on investment (cost reduction + avoidance savings) (%)
Supply management return on investment (cost reduction only) (%)
Supply management return on investment using salary expense (%)
Savings are validated by finance (%)
Cost reduction savings as a percent of managed spend (%)
Cost avoidance savings as a percent of managed spend (%)
Sourceable spend of top 10 suppliers as a percent of total sourceable spend (%)
Sourceable spend of top 50 suppliers as a percent of total sourceable spend (%)
Active suppliers that account for 80% of sourceable spend as a percent of total active suppliers (%)
Active suppliers that account for 90% of sourceable spend as a percent of total active suppliers (%)
Supply management FTE per $1 billion in revenue (#)
Supply management operating expense per supply management FTE ($)
Supply management salary expense per supply management FTE ($)
Supply management talent development per supply management FTE ($)
Sourceable spend per supply management FTE (millions) ($)
Managed spend per supply management FTE (millions) ($)
Managed spend per transactional buying FTE (millions) ($)
Managed spend per category management FTE (millions) ($)
Business relationship management FTE as a percent of total supply management FTE (%)
Category management FTE as a percent of total supply management FTE (%)
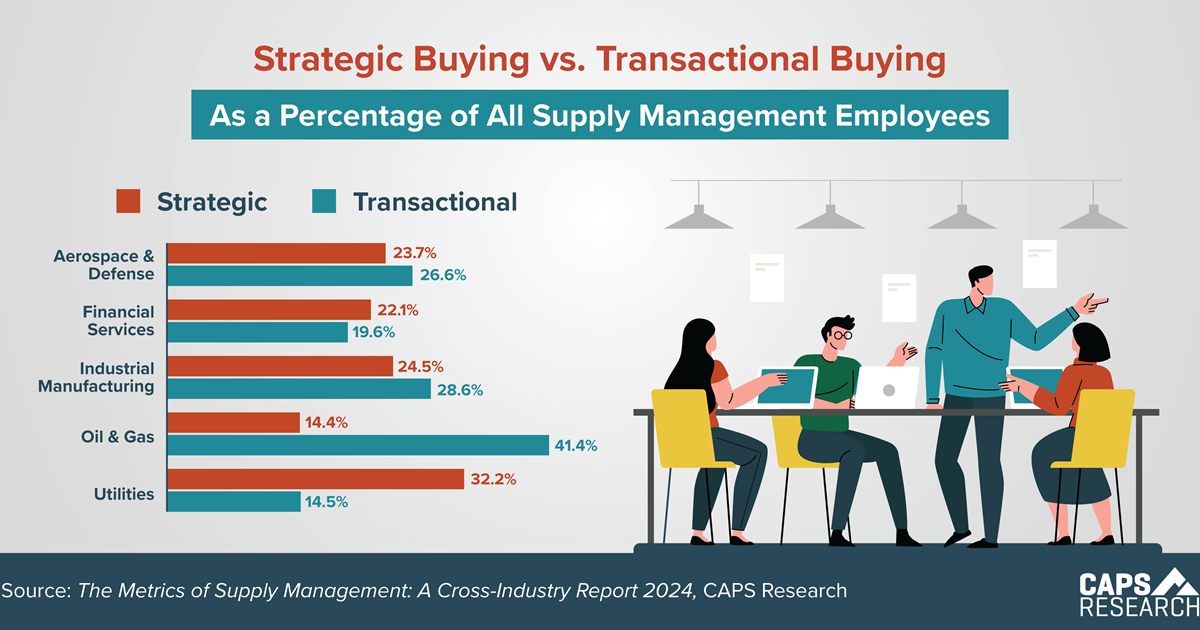
Strategic sourcing (strategic buying) FTE as a percent of total supply management FTE (%)
Transactional buying FTE as a percent of total supply management FTE (%)
Supplier relationship management FTE as a percent of total supply management FTE (%)
Supplier Environmental Sustainability FTE as a percent of total supply management FTE (%)
Supplier diversity FTE as a percent of total supply management FTE (%)
Supplier risk management FTE as a percent of total supply management FTE (%)
Data management, analytics FTE as a percent of total supply management FTE (%)
Systems & technology FTE as a percent of total supply management FTE (%)
Active suppliers per supply management FTE
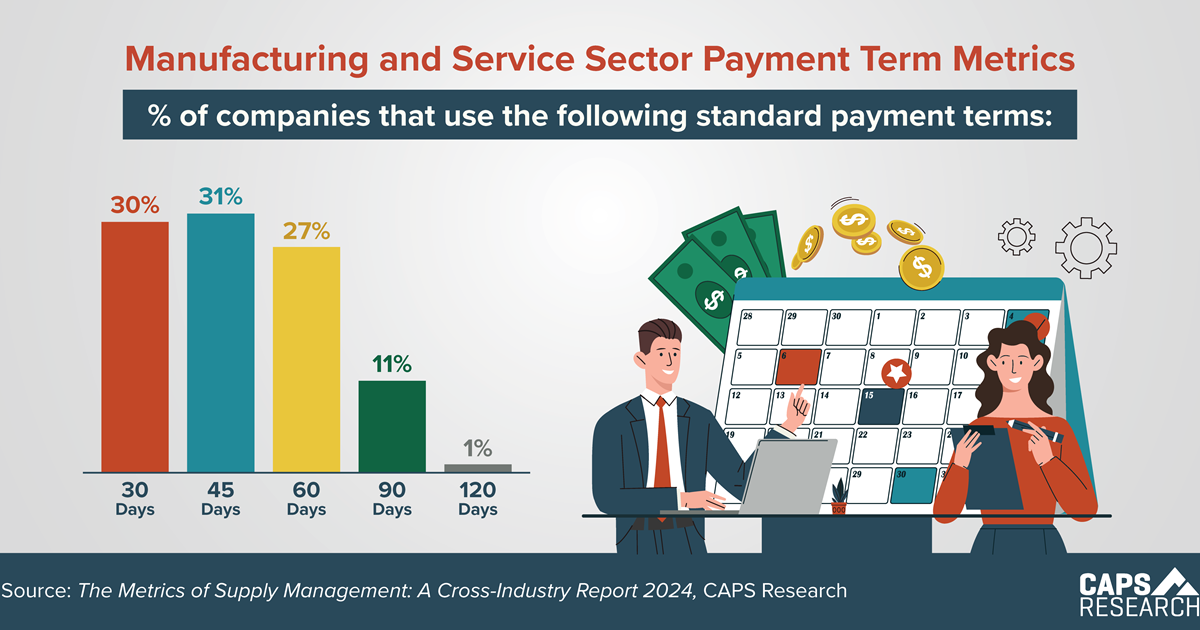
Standard payment term that is 30 days (% of companies) (%)
Standard payment term that is 45 days (% of companies) (%)
Standard payment term that is 60 days (% of companies) (%)
Standard payment term that is 75 days (% of companies) (%)
Standard payment term that is 90 days (% of companies) (%)
Percent of purchase orders processed automatically using robotic process automation (RPA) (#)
Average purchase order amount used in sourceable spend
Average cost per purchase order
Free KPIs for qualified participants
Are you ready to benchmark your org?
To participate in The Metrics of Supply Management survey and receive a copy of the final, aggregated results, please complete the form below.
This survey is designed to be completed by supply management practitioners at companies with annual revenue greater than $1B USD (or equivalent foreign currency).
Non-members can receive the report of each survey they submit.
Members can access all reports, but are encouraged to submit surveys to
increase the comparative breakouts only they receive.